


International Water Management Institute, PO Box 2075, Colombo, Sri Lanka. www.iwmi.org, Email: f.rijsberman@cgiar.org.
It is surprisingly difficult to determine whether water is truly scarce in the physical sense at a global scale (a supply problem) or whether it is available but should be used better (a demand problem). The paper reviews water scarcity indicators and global assessments based on these indicators. The most widely used indicator, the Falkenmark Indicator, is popular because it is easy to apply and understand but it does not help to explain the true nature of water scarcity. The more complex indicators are not widely applied because data are lacking to apply them and the definitions are not intuitive. Water is definitely physically scarce in densely populated arid areas, Central and West Asia, and North Africa, with projected availabilities of less than 1,000 cubic meters per capita per year. This scarcity relates to water for food production, however, and not to water for domestic purposes that are minute at this scale. In most of the rest of the world water scarcity at a national scale has as much to do with the development of the demand as the availability of the supply. Accounting for water for environmental requirements shows that abstraction of water for domestic, food and industrial uses already have a major impact on ecosystems in many parts of the world, even those not considered “water scarce”. Water will be a major constraint for agriculture in coming decades and particularly in Asia and Africa this will require major institutional adjustments. A “soft path” to address water scarcity, focusing on increasing overall water productivity, is recommended.
Introduction
There is much talk of a water crisis, of which the most obvious manifestation is that 1.2 billion people lack access to safe and affordable water for their domestic use (WHO 2003). Less well documented is that a large part of the 900 million people in rural areas that have an income below the one-dollar-per-day poverty line lack access to water for their livelihoods. The lack of access to water has major impacts on people’s well-being. Lack of access to safe drinking water and sanitation, combined with poor personal hygiene, causes massive health impacts, particularly through diarhoeal diseases, estimated to cost the lives of 2.18 million people three-quarters of whom are children younger than 5 years old, annually, and an annual global burden of disease measured as 82 million Disability Adjusted Life Years (Prüss et al. 2002). The poorest of the poor are also most affected by lack of access to water for productive purposes, resulting in a vicious cycle of malnutrition, poverty and ill health. Fresh water is critical to an array of global challenges from health, to malnutrition, poverty, and sustainable natural resources management. As discussed in this paper, it turns out to be difficult to assess whether water is truly scarce in the physical sense (a supply problem) or whether it is available but should be used better (a demand problem). This paper discusses the many dimensions of water scarcity in an effort to determine whether water scarcity is fact or fiction.
What is water scarcity? When an individual does not have access to safe and affordable water to satisfy her or his needs for drinking, washing or their livelihoods we call that person water insecure. When a large number of people in an area are water insecure for a significant period of time, then we can call that area water scarce. It is important to note, however, that there is no commonly accepted definition of water scarcity. Whether an area qualifies as “water scarce” depends on, for instance: a) how people’s needs are defined – and whether the needs of the environment, the water for nature, are taken into account in that definition; b) what fraction of the resource is made available, or could be made available, to satisfy these needs; c) the temporal and spatial scales used to define scarcity
Water is a very complex resource. Contrary to a static resource such as land, water occurs in a very dynamic cycle of rain, runoff and evaporation, with enormous temporal and spatial variations as well as variations in quality that completely govern its value to people and ecosystems. That water can be a nuisance (in floods) as well as a lifesaving resource (in droughts) is obvious, but that both conditions can occur in one location within a single year is more surprising. Annual average water availability in such a situation has little meaning to measure water scarcity. Large parts of monsoon Asia suffer from severe water scarcity while the average annual resource availability appears to be plentiful. Is there not enough or too much? If we build a dam to capture the flood water, prevent flood damage and make the excess water available during the dry period, then the place may no longer suffer from floods or droughts – the dam affects the water scarcity we measure and the existence of water infrastructure should therefore be accounted for in an analysis of water scarcity. Spatial scales also impact the measures of water scarcity. Obviously, in very large countries such as China there can be water scarcity in the Yellow River basin at the same time as flooding in the Yangtze river basin. Many smaller countries experience the same phenomenon over much smaller spatial scales too. Water quality ought to be another major variable in an assessment of water scarcity. Fresh water may become polluted as it flows downstream and become de facto unusable. Do we measure the polluted water as part of the resource available to satisfy needs (after treatment)? Or leave it out and conclude that there is scarcity?
To assess whether the water needs of all human users and the environment are secure or can be secured, and conversely whether water is scarce or not, requires an analysis of how much water of a specified quality is needed versus how much water is available, or can be made available, where and when. We hypothesize that an understanding of water scarcity is important because it affects the views of users and policy makers on the urgency to address the water crisis as well as their views on the most effective policies to address the water crisis. This paper reviews measures of water scarcity and their advantages as well as limitations, discusses water scarcity on a global and regional scale and the implications for policy.
Defining water scarcity: an overview of indicators1
The Falkenmark Water Stress Indicator
The figures most often heard or read about in the press represent scarcity as a relationship between water availability and human population, i.e. water availability per capita per year, usually on a national scale. The logic underpinning this choice is straightforward: if we know how much water is needed to satisfy a person’s needs then the water availability per person can serve as a measure of scarcity. The most widely used measure is the Falkenmark indicator or “water stress index” (Falkenmark, Lundqvist and Widstrand, 1989). They proposed 1,700m3 of renewable water resources per capita per year as the threshold, based on estimates of water requirements in the household, agricultural, industrial and energy sectors, and the needs of the environment. Countries whose renewable water supplies cannot sustain this figure are said to experience water stress. When supply falls below 1,000m3 a country experiences water scarcity, and below 500m3, absolute scarcity.
The major advantages that make this simple indicator almost unbeatable are that: a) the data are readily available; and b) its meaning is intuitive and easy to understand. As a result the indicator dominates the popular discussion of water scarcity, even though its disadvantages are clear as well. These limitations are: a) the annual, national averages hide important scarcity at smaller scales; b) the indicator does not take into account the availability of infrastructure that modifies the availability of water to users; and c) the simple thresholds do not reflect important variations in demand among countries due to, for instance, lifestyle, climate etc. Ohlsson (1998, 1999) modified the Falkenmark indicator by accounting for a society’s “adaptive capacity” – meaning the capacity to adapt to stress through economic, technological or other means. Ohlsson used UNDP’s Human Development Index to weight the Falkenmark’s indicator, and called it a “Social Water Stress Index”.
The Water Resources Vulnerability Index
Others have focussed on a more accurate assessment of the demand for water than taking fixed requirements per person as a proxy, on a national scale, and related that to the national, annual renewable water supply and national, annual demand for water. A major effort over several decades by a large team of researchers in the State Hydrological Institute in St Petersburg, Russia, led by Professor Igor Shiklomanov, is behind most published global analyses of water demand and availability in the last 15 years. An early publication on this group’s supply-demand analysis (Shiklomanov 1991) compared national annual water availability with assessments of national water demand in the agricultural, industrial and domestic sectors. In a global water assessment for the United Nations Commission on Sustainable Development, Raskin et al. (1997) use Shiklomanov’s basic data on water resource availability, but replace water demand with water withdrawals2 (intended as a more objective assessment of “use” than the more subjective “demand”), and present scarcity as the total annual withdrawals as a percent of available water resources, in what is referred to as a water resources vulnerability index. They suggest that a country is water scarce if annual withdrawals are between 20-40% of annual supply, and severely water scarce if this figure exceeds 40%. Alcamo et al. (1997, 2000) also use this definition for their “criticality ratio” - the ratio of water withdrawals for human use to total renewable water resources. The ratio is calculated by applying their global model Water Gap model and is used for various global analyses of water scarcity (e.g. Cosgrove and Rijsberman 2000a, 2000b and UNWWDR 2003). A similar definition is used by Vorosmarty and colleagues, who use climate models to assess water scarcity (Vorosmarty et al. 2000) and Montaigne (2002), who uses Vorosmarty’s analysis.
The limitations of the criticality ratio and similar indicators are that: a) the data on water resources availability do not take into account how much of it could be made available for human use; b) the water withdrawal data do not take into account how much of it is consumptively used (or evapotranspired) and how much could be available for recycling, through return flows; and c) the indicators do not take into account a society’s adaptive capacity to cope with stress.
Physical and Economic Scarcity Indicators
The International Water Management institute (IWMI) attempted to overcome all three above problems (Seckler at al. 1998). The IWMI analysis takes into account the share of the renewable water resources available for human needs (accounting for existing water infrastructure), the primary water supply. Its analysis of demands is based on consumptive use (evapotranspiration) and the remainder of water withdrawn is accounted for as return flows. Seckler et al. then analysed, on a national scale3, the future adaptive capacity, primarily through an assessment of potential development of infrastructure and an increase of irrigation efficiency through improved water management policies4. Countries that will not be able to meet the estimated water demands in 2025, even after accounting for future adaptive capacity, are called “physically water scarce”. Countries that have sufficient renewable resources, but would have to make very significant investment in water infrastructure to make these resources available to people, are defined as “economically water scarce”.
The disadvantage of the IWMI model, however, is its intricacy and resulting complexity of assessment. Unlike the per capita indicators and even the simpler supply-demand models, it is not intuitive, and hence relatively inaccessible to the wider public. It also relies on considerable expert judgement because data are not available to assess all components of the indicators. While the IWMI water scarcity map is an often quoted reference, the more complex definitions of scarcity are unfortunately not used by other authors or in other analyses, other than Cosgrove and Rijsberman (2000). The IWMI model is also still an aggregate, national analysis and does not attempt to analyse whether individuals have safe and affordable access to water to meet their needs.
Water Poverty Index
Sullivan et al. (2003) developed a disaggregated approach that tries to assess whether individuals are water secure at the household and community level. They developed the “Water Poverty Index” that attempts to reflect both the physical availability of water, the degree to which humans are served by that water and the maintenance of ecological integrity. The index clusters components in five dimensions: access to water; water quantity, quality and variability; water uses for domestic, food and productive purposes; capacity for water management; and environmental aspects. The indicator has the advantage of its comprehensiveness, but is hampered by its complexity and lack of intuitive understanding – as with all similar indices. It has been applied at the community level for pilot sites in Sri Lanka, Tanzania and South Africa and its developers see great potential in its use.
Moving all the way from the simple Falkenmark index to the all-inclusive, holistic Water Poverty Index, where the latter addresses, in principle, all drawbacks of the former, this author finds it unlikely that the use of the Falkenmark indicator will be replaced by the Water Poverty Index any time soon. The attraction of a simple, easy-to-understand indicator such as the Falkenmark indicator is simply too important to be replaced by a complex dimensionless index.
Analysing Global Water Scarcity
Water is scarce in arid areas
The overall conclusion of all global water scarcity analyses is that a large share of the world population – up to two-thirds - will be affected by water scarcity over the next several decades (Shiklomanov 1991; Raskin et al. 1997; Seckler et al. 1998; Alcamo et al. 1997, 2000; Vorosmarty et al. 2000; Wallace 2000; Wallace and Gregory 2002). Certainly it is clear and inescapable that, in terms of the Falkenmark index, as the population grows there will be proportionally less water available per capita as the resource base is more or less constant. The most obvious conclusion from these analyses is that water will be scarce in areas with low rainfall and relatively high population density. Many countries in the arid areas of the world, particularly Central and West Asia and North Africa, are already close to, or below the 1,000 m3/capita/year threshold. This is the part of the world that is most obviously and definitely water scarce in the physical sense, without much further debate. According to Wallace (2000), in 2000, people had less than a thousand cubic meters per year in the North-Africa belt (from Morocco to Egypt and including Sudan), and between one and two thousand in the Middle East and Southern Africa. For the most populous country of this region, Egypt, the Falkenmark indicator is likely to drop below 500 m3/capita/year within the next 25 years. Wallace (2000) estimates that in essence all of North, Eastern and Southern Africa, and the Middle East, will drop below 1,000 m3/capita/year before 2050. West Africa and large parts of South and South-east Asia would be in the one to two thousand range at that time.
It is often assumed that such water scarcity means that therefore people have insufficient water for their domestic use but that is not necessarily the case. At a minimum water requirement per capita of 50 litres per person per day, the domestic requirement is less than 20 m3/capita/year. As I have argued elsewhere (e.g. Rijsberman 2004), the total amount of water required for domestic purposes is small, compared to the water required for other basic needs and is essentially unaffected by water scarcity. The people that lack access to water supply and sanitation are not affected by water scarcity in the physical sense, as expressed by the Falkenmark index, but lack access because the water service delivery is poor, or because they do not have access to sufficient financial resources to avail themselves of the services, i.e. they are poor.
People require thousands of litres of water per day to produce their food, however, depending on their diet and lifestyle. To produce one kilogram of cereal grains requires about one cubic meter (m3), or a thousand litres, of crop evapotranspiration. However, one kilogram of meat requires much more water to produce – depending on how much feed5 is given to the animals versus animals that graze on rainfed pastures. In California for example, about 13.5 m3 of water is used to produce one kilogram of beef. Renault and Wallender (2000) estimate that a typical diet of a person from USA requires about 5,400 litres of water in the form of evapotranspiration per day. A vegetarian diet with approximately the same nutritional value is responsible for the consumption of 2,600 liters of water per day. On average, it takes roughly seventy6 times more water to grow food for people than people use directly for domestic purposes7 (see also SIWI and IWMI 2004). In addition, the large majority (up to 90%) of the water provided to people for domestic purposes is returned after use as wastewater and can be recycled, while most of the water (40 to 90%) provided to agriculture to grow food is consumed (evapotranspired) and cannot be re-used.
The Falkenmark indicator thresholds do not indicate that water is becoming scarce for domestic purposes, but that water is becoming scarce for food production. Yang et al. (2003), from an analysis of water availability, food imports and food security, concluded that there is a threshold of about 1500 m3/capita per year below which a country’s cereal imports become strongly inversely correlated with its renewable water resources. The countries in Africa and Asia that will be below this threshold in 2030 are given in Table 1.
Table 1. List of countries in Africa and Asia having renewable water resources below the calculated threshold of 1500 m3/capita/year by the year 2030.
Afghanistan |
Egypt |
Kenya |
Niger |
Tanzania |
Algeria |
Eritrea |
Korea Republic |
Nigeria |
Togo |
Burkina Faso |
Ethiopia |
Lebanon |
Pakistan |
Tunisia |
Burundi |
India |
Libya |
Rwanda |
Uganda |
Cape Verde |
Iran |
Malawi |
Saudi Arabia |
Emirates |
Comoros |
Israel |
Maldives |
Somalia |
Yemen |
Cyprus |
Jordan |
Morocco |
South Africa |
Zimbabwe |
Bold names are the countries entering the water deficit country list after the year 2000. | ||||
Source: Yang et al. (2003).
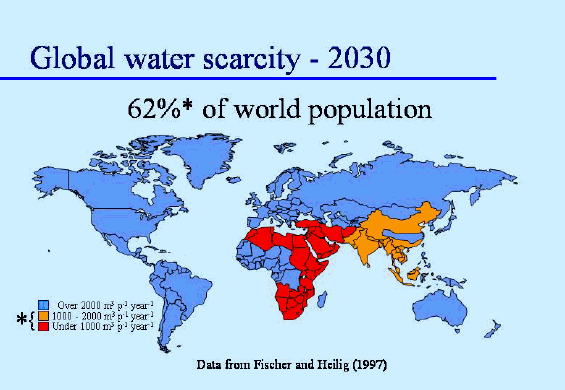
Figure 1. Water scarcity in 2030 based on the Falkenmark Indicator (Source: Wallace 2000).
Assessing the demand for water
Water use is not just governed by population growth, however. In the 20th century the world population tripled but water use increased six fold (Cosgrove and Rijsberman 2000a). Many water scarcity projections assume a rapidly increasing water use per capita, usually related to rising incomes (e.g. Shiklomanov 1998; Raskin et al. 1997; Alcamo et al. 1997, 2000). Given that 1.2 billion people currently lack access to safe and affordable water and that the world is rapidly urbanising and industrialising, it is safe to assume that domestic and industrial demands will rise rapidly in developing countries, but it is much less evident how other demands for water will develop. How much water we will need per person in the coming decades to satisfy our daily needs is not fixed, as the Falkenmark indicator suggests, but depends on a myriad of policy and personal choices. This is in fact the heart of the matter for future water scarcity projections.
Alcamo et al.(1997, 1999), using the Water Gap model and criticality ratio and their assumptions on how water use will grow with income, have estimated that 4 billion people, or more than half of the world’s population, will be living in countries facing high water stress (criticality ratio greater than 40 percent) by 2025, see Figure 2. Shiklomanov’s analysis, based on his forecasts of rising demands, suggests that water withdrawals will rise by 25%, between 2000 and 2025 from 4,000 to 5,000 cubic kilometre (km3) (Shiklomanov 1998; Cosgrove and Rijsberman 2000a). Gleick (2000), however, in an analysis of water demand projections over several decades has found that these forecasts were consistently too high. Forecasts of dramatic rises over the next several decades would not be realised, he found, but new forecasts would continue to project sharp increases in demand for the next period. The future demand for water is strongly correlated with our assumptions related to the values and lifestyles of future generations (Gallopin and Rijsberman 2000).

Figure 2. Water stress analysis based on the criticality ratio (Source: Alcamo et al. 2000).
The sharpest divergence in views is between those arising from the agricultural and environmental perspectives (cf. Hofwegen and Svendsen 2000; IUCN 2000; HRH The Prince of Orange and Rijsberman 2000; ODI 2002). These conflicting perspectives are laid out by Rijsberman and Molden (2001) in a background paper for the Bonn International water Conference held in December 2001. From an agricultural perspective the argument is as follows. The Green Revolutionbased on modern, high yielding plant varieties, requiring high inputs of fertilizer and waterhas led to increases in world food production at a pace that outstripped population growth. Food prices have declined markedly. Increased water use in irrigated agriculture has benefited farmers and the poor (see, for example, Rijsberman 2004). In spite of increases in agricultural production and lower food prices, the task of providing food security to all is incomplete. Malnutrition persists, mostly in South Asia and Sub-Saharan Africa. Much malnutrition exists in regions dubbed “economically water scarce” by IWMI (2000), meaning that while there is water available in nature, sometimes abundantly, it has not been developed for human use. Small farmers and the poor are particularly disadvantaged and can face acute water scarcity. They do not have access to water to satisfy their needs for either food security or sustainable livelihoods. The agricultural community sees continued growth of irrigation as an imperative to achieve the goals adopted by the international community to reduce hunger and poverty. Under a base scenario that included optimistic assumptions on productivity growth and efficiency, IWMI estimated that 29% more irrigated land will be required by the year 2025, and because of gains in productivity and more efficient water use, the increase in diversions to agriculture would be 17%. FAO (2002, 2003a, 2003b) and Shiklomanov (1998) had comparable results.8 IWMI’s water scarcity map is based on a scenario dominated by food production sufficient to meet the needs of future generations as well as reduce malnutrition, at the most efficient levels of water use imaginable under essentially a business as usual scenario9 (see Figure 3).
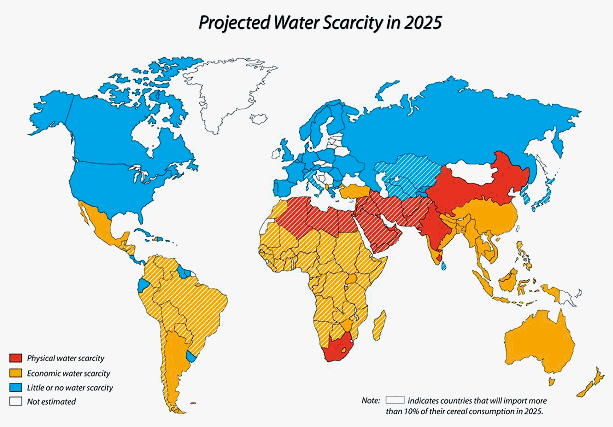
Figure 3. IWMI Water Scarcity Map (Source: IWMI, 2000).
The sharply increased water and chemical use that fuelled the Green Revolution has contributed to environmental degradation, however, and threatened the resource base upon which we depend for food and livelihoods. Citing similar international commitments to maintain and improve environmental quality and biodiversity, many in the environmental community see it as imperative that water withdrawn for agriculture is reduced, not increased. Irrigation development has impaired the ability of many ecosystems to provide valuable goods and services, including flood protection, water purification, and provision of food and fiber. It is argued that not enough attention is given to alternative, but more sustainable means of production. Taken from the perspective of sustainable use, Alcamo et al. (2000) projected an 8% decrease in the amount of water that should be diverted to irrigation. The difference between the 17% increase and 8% decrease is on the order of 625 km3 of waterclose to the 800 km3 of water that is presently used globally for urban and industrial use.10 In a review of the impacts of irrigated agriculture on wetlands and wildlife conservation Lemly et al. (2000) conclude that the conflict between irrigated agriculture and wildlife conservation has reached a critical point on a global scale. Smakthin et al. (2004) have attempted to analyse environmental water scarcity on a global scale (see Figure 4). Even though this is a first order attempt, it does suggest that in many parts of the world human water use has already impacted the health of ecosystems significantly.

Figure 4. Water Stress as human use of renewable water resources, after accounting for environmental water requirements. (Source: Smakthin et al. 2004).
Finally, in Figure 5, a map is shown of the even-broader / more-inclusive analysis of water scarcity based on the Water Poverty Index.
Implications for water scarcity in different regions of the world
This author’s conclusions for water scarcity in the major regions of the world, analysed at national level as depicted in the various maps above, are as follows.
- When the needs of the environment are not taken into account explicitly, the shared conclusion of the various analyses is that there is no water scarcity in the developed world (Europe, North America, Australia, Japan).
- In all analyses there is already absolute or physical water scarcity affecting food production and productive water use (not water supply and sanitation) in the arid parts of the world, for example in North Africa, and the Middle East.
- Depending on the definition of water scarcity using the various indicators, there are varying opinions on the degree and severity of water scarcity in large parts of Asia and Africa in 2025. There is broad agreement, however, that there will be significantly increasing water scarcity that will turn “water’ into a key, or the key, limiting factor in food production and livelihoods generation for poor people in rural virtually throughout rural Asia and most of Africa, with particularly severe water scarcity in the bread baskets of North-West India and Northern China.
- Latin-America is relatively water abundant, at least as analysed at the national level, and is not showing up as water scarce, unless as seen in IWMI’s definition of “economically water scarce”, i.e. implying the need for considerable investments in the water sector to make the resources available to satisfy people’s needs.
- Most small islands in the Caribbean and the Pacific are facing severe water scarcity and will face increasing water scarcity.
- When taking into account the water needs of ecosystems, then there are considerable parts of Europe, North America, part of South-West Australia, and part of South America that already face considerable water scarcity, particularly where irrigated agriculture and ecosystems compete for water resources. Accounting for the needs of ecosystems will significantly exacerbate water scarcity issues in many parts of Asia.
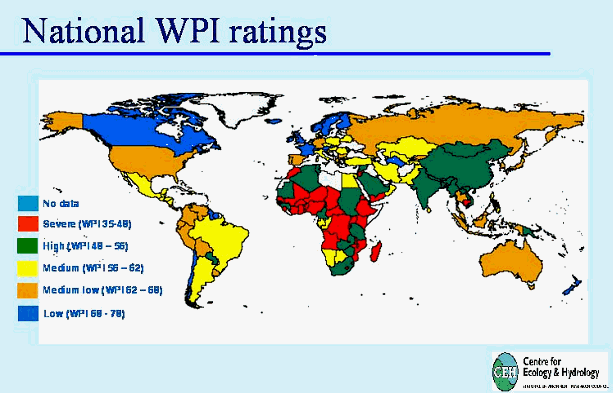
Figure 5. Water scarcity based on the Water Poverty Index at national scale(Source: Sullivan et al. 2000)
As discussed by Gleick (2002), global and national analyses of water scarcity serve many purposes, from raising awareness to pinpointing specific vulnerabilities and threats. They also have considerable drawbacks, however. Water is a dynamic and complex resource hard to describe in simple indicators, but data availability limits the application of more sophisticated indicators. Water problems are often local, while water data are usually large-scale or national. These considerations have to be taken into account when interpreting the conclusions given above.
Water scarcity at the river basin level
As discussed above, the global analysis of water scarcity is of very limited use in assessing whether individuals or communities are water secure. The river basin is more and more adopted as the appropriate scale to understand the key processes with increasing water scarcity as human use goes up to the point where basins “close” (Keller et al. 1998; Molden 1997; Molden et al. 2001a, 2001b; Turton and Ohlsson, 1999; Molle 2003). Keller, Molden and their co-authors describe a linear three-stage evolution of river basin development as water becomes progressively scarcer, starting with (a) a focus on augmenting supply through infrastructure; to (b) emphasis on water conservation and improved efficiency of use; to (c) a shift to re-allocation of water from one user to another, presumably shifting to a higher value use. Turton, Ohlsson and Molle attempt to develop this linear economic-engineering model further, through a deeper understanding of the socio-economic context in which water use takes place and the political economy of water resources development. These approaches serve both to assess and understand the complex physical flows of water in a basin11 as well as the many responses employed by, or open to, users and communities that face water scarcity. These analyses do not result in simple indicators.
Others have attempted to analyse water resources at a more refined spatial scale with essentially the same indicators as those employed at the global/national scale for example, Southern and Eastern Africa (Meigh et al. 1998), see Figure 6.

Figure 6: Example of water scarcity analysis for Southern and Eastern Africa (Source: Meigh et al. 1998).
Rijsberman and Mohamed (2002) postulate that the impact of water scarcity on society12 is correlated to the rate of change in water scarcity in a basin. If the availability of water in an area decreases rapidly, say from 2,000 m3/capita/year to 1,500 m3/capita/year in the span of a decade, then people may experience scarcity more intensely then when water availability dropped at a lower rate but to an absolutely lower level13. Where water scarcity is constant or changes slowly, systems of water use can adapt to those conditions. People living in the deserts of Rajasthan in North India, for example, have managed to have thriving civilisations for centuries with no more than 200 mm of rainfall. Generally speaking, water institutions have developed in response to the local water scarcity context. This can be seen in the United States of America, for example, where the system of riparian rights has been adopted in the humid US East, while the system of prior appropriation, essentially tradable water rights and better suited to deal with water scarcity, was adopted in the dry US West. Rapidly increasing relative water scarcity requires water users and water institutions to adapt to new scarcity conditions. When institutions are in the adaptation process to the new levels of scarcity, the users are most affected by scarcity, or water scarcity is most “felt”. The relative scarcity of a resource also determines its value to the user, increasing relative scarcity translates into increasing water values. As the scarcity and value of water goes up, so does the competition for water among users. With increasing competition, and lagging institutions, conflicts arise. Typical conflicts are those between rapidly growing urban areas that claim water from agriculture, for example, or conflicts between agriculture and the environment as agriculture seeks to expand or looks for new resources to replace those given up to urban areas. Conflicts among users over the allocation of water increase with increasing relative water scarcity. Molle (2003) proposes a typology of the heterogeneous societal responses to scarcity. Institutional responses to increasing scarcity are often triggered by shock events, such as droughts, for example. Australia’s evolving system of water governance, with its cap on development in the Murray-Darling basin, system of tradable rights and experimentation with returning water from use in agriculture back to the environment, is an interesting case in point.
Water Scarcity in Perspective
Water scarcity as discussed in this paper relates to renewable water resources as they are usually defined, i.e. the runoff in streams and rivers plus the annual recharge to aquifers14. That definition leaves out roughly 60 percent of the annual rainfall, however. This additional water infiltrates in the soil15, becomes soil moisture, and evapotranspires without having entered into either rivers or groundwater. For most human uses this water is not relevant, as it cannot be taken out and used for any other purpose, but for the largest water user of all, agriculture, as well as for the environment, this water is obviously hugely important. This water sustains rainfed agriculture and ecosystems. Irrigation is nothing more or less than an intervention to supplement deficits in soil moisture after all. Traditionally rainfed agriculture and irrigated agriculture have been treated as two separate systems but with the rise of small-pump based groundwater irrigation, micro-irrigation and a host of rainwater harvesting techniques this no longer makes much sense. Instead of two separate systems there is a continuum of systems, with pure rainfed on one end and large scale surface water irrigation systems on the other end of the spectrum, and many others in between. For this reason at IWMI we now prefer to speak of water management for agriculture, encompassing all options. This implies, however, that an analysis of water scarcity for agriculture can no longer concentrate on renewable water resources only, but has to look carefully at the use of all water, and the interaction among the various sources. It also brings into sharper focus the role of the soil, the soil moisture reservoir, in the soil-water interaction.
Addressing Water Scarcity: the soft path
The traditional, engineering response to water scarcity has been to construct infrastructure, particularly dams, to increase human control over water resources and make a larger share of the total renewable resources available for human use. While that approach has, by and large, been successful in producing its primary output, cheap food, and has provided water supply and sanitation to large numbers of people, the flip side is also clear. Many people do not have access to safe and affordable water supply, despite enormous investments, close to half the world population lacks access to sanitation, many rural poor do not have access to water for productive purposes, groundwater levels in key aquifers are falling rapidly, many rivers are no longer reaching the sea, etc. etc. (e.g. Cosgrove and Rijsberman 2000a). Over the last several decades this has given rise to a backlash against water infrastructure investments and a well-established literature that calls for shifts from supply management to demand management. An expression of this shift in thinking is the “integrated water resources management” movement that has given birth to organisations such as the World Water Council and the Global Water Partnership. The most tangible proposals that have come out of this direction are: (a) to involve users more in the management of water, often through the establishment of forms of water user associations; (b) to price water and/or make it a trade-able commodity; and (c) to establish river basin authorities that integrate the usually fragmented government responsibilities for water into a single authority responsible for a hydrographically defined area, the river basin. All three of these approaches have been successfully employed in some areas and have been unsuccessful in others – or, as most obviously in the case of pricing water – have become highly controversial. None of these are usually presented as responses to increasing water scarcity – even water pricing is usually more presented as a response to unsustainable recovery rates for operation and maintenance costs – but all of these actions have a role to play in the institutional adaptation to increasing scarcity.
Some well-known water authors such as Sandra Postel (1998, 1999, 2001) and Peter Gleick (2000, 2002, 2003) have questioned the sustainability of the current system if it is not transformed in a significant way. Sandra Postel has proposed that a large-scale shift towards higher productivity, decentralized micro-irrigation would be the way forward to increase water productivity16 and make water use sustainable. Narayanamoorthy (2004) examines the potential of drip irrigation to help solve the water scarcity crisis in India and concludes that there is an enormous potential. Others, such as Molle and Turral (2004), analyse the potential for demand management to make water use sustainable at the basin level, but conclude that the potential is over-estimated. This debate is not likely to be resolved any time soon. It is in fact, in this author’s opinion a healthy debate that helps along the institutional adjustment to water scarcity discussed above.
Gleick (2002, 2003) discusses what he calls17 the “soft path for water” – a term that hails from the energy sector and that in essence focuses on the improvement of the overall productivity of water rather than endlessly seeking new supplies – as the appropriate response to water scarcity. There is an interesting parallel, not often drawn, between the water sector and the energy sector. The oil crisis of the seventies led to many studies projecting energy scarcity and to heated debates on whether there really was energy scarcity – a debate that continues until today with every major blackout such as the US has experienced in the last few years. The most important impact of that debate on energy scarcity was probably that it led to very significant increases in energy efficiency. In other words, the link between economic growth and energy use – considered fixed for a long time – has been broken; economies have become considerably less energy intensive. A similar shift is needed for water and according to Gleick the trends can already be observed in the US economy. Gleick (2002) presents data that show that for the US economy the economic productivity of water was relatively constant from 1900 to 1970, at US$6.50 of gross domestic product per cubic meter of water withdrawn, and has subsequently risen dramatically to about US$15; total withdrawals at a national scale have stabilized and the use per capita has fallen.
Specifically for water and agriculture, IWMI has been calling for a similar focus on increased water productivity through an approach that is very similar to Gleick’s “soft path”, in various publications over the last 7-8 years (e.g. most recently Rijsberman 2004). This has culminated in a book that reviews the potential for improvement (Kijne et al. 2003) and a number of research initiatives that focus on increasing water productivity for food production and rural livelihoods, i.e. a CGIAR system-wide initiative called Comprehensive Assessment of Water Management in Agriculture (www.iwmi.org/assessment) and the CGIAR Challenge Program on Water and Food (www.waterforfood.org). Together these represent a major effort by the international community to address water scarcity in agriculture. The most important question in the current debate on water scarcity is not so much whether it is true or not, whether we are going to run out of water or not, whether water scarcity is fact or fiction, but whether this debate will help increase water productivity.
References
Alcamo, J, T Henrichs and T Rosch (2000). World Water in 2025: Global Modeling and Scenario Analysis, in: Rijsberman (ed), World Water Scenarios Analyses, (World Water Council, Marseille).
Alcamo, J, P Doll, F Kaspar, and S Siebert (1997). Global Change and Global Scenarios of water Use and Availability: An Application of WaterGAP 1.0. (University of Kassel, CESR, Kassel).
Cosgrove, WJ and FR Rijsberman (2000a). World Water Vision: Making Water Everybody’s Business. (Earthscan Publications, London).
Cosgrove, WJ and FR Rijsberman (2000b). Challenge for the 21st Century: Making Water Everybody's Business. Sustainable Development International (2): 149-156.
Falkenmark, M (2000). Competing freshwater and ecological services in the river basin perspective: An expanded conceptual framework. Water International, 25(2): 172–177.
Falkenmark, M, J Lundquist and C Widstrand (1989). Macro-scale water scarcity requires micro-scale approaches: Aspects of vulnerability in semi-arid development. Natural Resources Forum 13(4):258-267.
FAO (2003a). Agriculture, food and water: A contribution to the World Water Development Report. (FAO, Rome).
FAO (2003b). Unlocking the water potential of agriculture. (FAO, Rome).
FAO (2002). Crops and Drops: Making the best use of water for agriculture. (FAO, Rome).
Gallopin, GC and FR Rijsberman (2000). Three Global Water Scenarios. International Journal of Water. (1)1:16-40.
Gleick, P (2003). ‘Soft Path’ solution to 21st-century water needs. Science 320(5650):1524-1528.
Gleick, P (2002). The World’s Water: The Biennial Report on Freshwater Resources 2002-2003. (Island Press. Washington DC).
Gleick, P (2000). The World’s Water: The Biennial Report on Freshwater Resources 2000-2001. (Island Press. Washington DC).
HRH The Prince of Orange and FR Rijsberman (2000). Summary Report of the 2nd World Water Forum: From Vision to Action. Water Policy 2(2000):387-395.
Hofwegen, P van, and M Svendsen( 2000). A vision for water for food and rural development. Document presented to the 2nd World Water Forum. http://www.watervision.org
IUCN (2000). Vision for water and nature: A World Strategy for Conservation and Sustainable Management of Water Resources in the 21st Century. (IUCN, Gland, Switzerland).
IWMI (2000). World Water Supply and Demand in 2025. In: FR Rijsberman, ed. World Water Scenario Analyses. (World Water Council, Marseille).
Keller, J, A Keller and G Davids (1998). River basin development phases and implications of closure. Journal of Applied Irrigation Science 33(2):145-164.
JW Kijne, R Barker and DJ Molden, eds. (2003). Water Productivity in Agriculture: Limits and Opportunities for Improvement. (CABI with IWMI, Wallingford).
Lemly, AD, RT Kingsford and JR Thompson (2000). Irrigated Agriculture and Wildlife Conservation: Conflict on a Global Scale. Environmental Management 25(5):485-512.
Meigh, JR, AA McKenzie, BN Austin, RB Bradford, and NS Reynard (1998). Assessment of Global water Resources – phase II. Estimates of present and future water availability in Eastern and Southern Africa. (Center for Ecology and Hydrology, Wallingford).
Molden, DJ, R Sakthivadivel and M Samad (2001a). Accounting for changes in water use and the need for institutional adaptation. In: CL Abernethy, ed. Proceedings of an international workshop on “Integrated Water Management in Water-Stressed River Basins in Developing Countries: Stratgeies for Poverty Alleviation and Agricultural Growth. pp. 73-87. (IWMI, Colombo).
Molden, D, R Sakthivadivel and J Keller (2001b). Hydronomic Zones for Developing Basin Water Conservation Strategies. IWMI Research Report 56. (IWMI, Colombo).
Molden, DJ (1997). Accounting for water use and productivity. SWIM Paper 1. (IWMI, Colombo).
Molle F and H Turral (2004). Demand management in a basin perspective: is the potential for water saving overrated? Paper presented at the International water Demand management Conference, June 2004, Dead Sea, Jordan.
Molle, F (2003). Development Trajectories of River Basins: A Conceptual Framework. IWMI Research Report 72. (IWMI, Colombo).
Montaigne, F (2002). Water Pressure. National Geographic. September 2002:2-32.
Narayanamoorthy, A (2004). Drip Irrigation in India: Can it solve the Water Crisis? Water Policy 6(2):117-130.
ODI (2002). The "Water Crisis": Faultlines in the Global Debates. ODI Briefing Paper July 2002. (ODI, London).
Ohlsson, L(1999). Environment, scarcity and conflict: A study of Malthusian concerns. (Department of Peace and Development Research, University of Göteborg, Göteborg).
Ohlsson, L (1998). Water and social resource scarcity. FAO Issue Paper (FAO, Rome).
Postel, S (2001). Safeguarding our water - Growing more food with less water. Scientific American February, 2001: pp. 40-45.
Postel, S (1999). Pillar of Sand: Can the Irrigation Miracle last? (Norton, New York).
Postel, S (1998). Water for food production: Will there be enough in 2025? BioScience 48 (8):629-637.
Pruss, A, K Day, L Fewtrell and J Bartram (2002). Estimating the Global Burden of Disease from Water, Sanitation and Hygiene at a Global Level. Environmental Health Perspectives. 110(5):537-542.
Raskin, P, P Gleick, P Kirshen, G Pontius and K Strzepek (1997). Water Futures: Assessment of long-range patterns and prospects. (Stockholm Environment Institute, Stockholm).
Renault, D and WW Wallender (2000). Nutritional Water Productivity and Diets. Agricultural Water Management 45(2000):275-296.
Rijsberman, FR (2004). The Water Challenge. In: D Lomborg. Global Crises, Global Solutions (Cambridge University Press, Cambridge, in press).
Rijsberman, FR and A Mohamed (2003). Water, food and environment: conflict or dialogue? Water Science and Technology 47(6): 53-62.
Rijsberman, FR (2002a). World Water Supplies: are they adequate? Paper presented at the 3rd Rosenberg International Forum on Water Policy, Canberra, Oct 7-11.
Rijsberman, FR (2002b). Troubled Waters, Water Troubles: Overcoming an important constraint to food security. In: IFPRI. Sustainable Food Security for all by 2020: Proceedings of an International Conference, September 4-6, 2001, Bonn. p 141-144. (IFPRI, Washington DC).
Rijsberman, FR and DJ Molden (2001). Balancing Water Uses: Water for Food and Water for Nature. Thematic Background papers. International Conference on Freshwater, Bonn, 3-7 December. Pp. 43-56.
Rijsberman, FR ed. (2000). World Water Scenario Analyses. (World Water Council, Marseille).
Seckler, D, DJ Molden and R Sakhtivadivel (2003). The concept of Efficiency in water Resources management and Policy. In: JW Kijne, R Barker and DJ Molden, eds. Water Productivity in Agriculture: Limits and Opportunities for Improvement. (CABI with IWMI, Wallingford)
Seckler, D, U Amarasinghe, DJ Molden, R de Silva, R Barker (1998). World Water Demand and Supply, 1990 to 2025: Scenarios and Issues. IWMI Research Report 19. (IWMI, Colombo).
SIWI and IWMI (2004). Water – More Nutrition per Drop: Towards Sustainable Food production and Consumption Patterns in a Rapidly Changing World. Background report for CSD12, New York, April 2004. (SIWI, Stockholm).
Shiklomanov, IA (1991). The World’s water resources. In: Proc. Int. Symp. To Commemorate 25 Years of the IHP. Pp. 93-126. (UNESCO/IHP, Paris).
Shiklomanov, IA (1998). World Water Resources: An Appraisal for the 21st Century. IHP Report. (UNESCO, Paris).
Smakthin, V, C Revenga and P Doll (2004). Taking into Account Environmental Water Requirements in Global-scale Water Resources Assessments. Comprehensive Asessment of Water Management in Agriculture Research Report 2 (IWMI, Colombo).
Sullivan, CA, JR Meigh, AM Giacomello, T Fediw, P Lawrence, M Samad, S Mlote, C Hutton, JA Allan, RE Schulze, DJM Dlamini, WJ Cosgrove, J Delli Priscoli, P Gleick, I Smout, J Cobbing, R Calow, C Hunt, A Hussain, MC Acreman, J King, S Malomo, EL Tate, D O’Regan, S Milner and I Steyl (2003). The water Poverty Index: Development and application at the community scale. Natural Resources Forum 27(2003):189-199.
Sullivan, CA, JR Meigh, S Simon, P Lawrence, R Calow, A McKenzie, MC Acreman and RV Moore (2000) The Development of a Water Poverty Index. Report to DFID, 94 pp. (CEH, Wallingford).
Turton, AR and L Ohlsson (1999). Water scarcity and social stability: towards a deeper understanding of the key concepts needed to manage water scarcity in developing countries. SOAS Working Paper. (University of London, London).
UNWWDR (United Nations World Water Development Report) (2003). Water for People, Water for Life. (UNESCO, Paris).
Vorosmarty, CJ, P Green, J Salisbury and RB Lammers (2000). Global water resources: vulnerability from climate change and population growth. Science 289:284-288.
Wallace, JS and PJ Gregory (2002). Water resources and their use in food production. Aquatic Sciences 64(2002):363-375.
Wallace, JS (2000). Increasing agricultural water efficiency to meet future food production. Agriculture, Ecosystems and Environment. 82:105-119.
WHO (2003). Water Sanitation and Health Website:http://www.who.int/water_sanitation_health/hygiene/en/.
Yang, H, P Reichert, K Abbaspour and AJB Zehnder (2003). A Water Resources Threshold and its Implications for Food Security. Environmental Science and Technology 37:3048-3054.
1 Gleick (2002) provides a useful, extended overview of the history, background and limitations of water indicators and idices as measures of water well-being.
2 Water withdrawals are defined as the amount of water taken out of rivers, streams or groundwater aquifers to satisfy human needs for water.
3 For all but the biggest countries, China and India, that were split into two sections.
4 For the period 2000-2025.
5 For instance animal fodder grown under irrigated conditions.
6 Based on a domestic requirement of 50 litres per person per day and a food requirement of 3,500 litres per person per day.
7 And roughly one thousand times more than people need to drink.
8 FAO (2000) estimated a 34% increase in irrigated area, and a 12% increase in irrigation diversions, and similarly Shiklomanov (1998) projected a 27% increase in irrigated diversions.
9 That is, an effort was made to project likely water use efficiency increases and development of infrastructure, from current trends.
10 To get an idea of the magnitude, Egypt’s High Aswan Dam releases annually about 55 km3, so the difference is equivalent to more than 10 High Aswan Dams annual supply of water. Put in other terms, this is more than the 500km3 projected to be used for domestic water supply worldwide in 2025.
11 When a user captures and diverts water from a stream, or pumps it from an aquifer, it is difficult to determine whether that water has already been used upstream, or how this user’s consumptive use and return flow will affect other users downstream. These complex processes continue to stymie many researchers, policy makers and users, and are a constant source of confusion, debate and conflict.
12 That is, whether users experience scarcity and crisis at a given level of resource availability.
13 Say from 1600 to 1400 m3/capita/year over 10 years.
14 These renewable resources are sometimes referred to as “blue water”
15 The soil water is sometimes referred to as green water. Together, the blue and green water encompass the complete hydrological cycle, i.e. total rainfall is green water plus blue water.
16 I prefer to use “water productivity” – the output of goods and services, in physical or monetary terms per unit of water used consumed– rather than the often confusing irrigation efficiency or water use efficiency. For a discussion of the arguments see Seckler et al. (2003).
17 The “soft path” term is attributed by Gleick (2002) to Amory Lovins of the Rocky Mountain Institute.

Search Site
- Crop Science
- Help/Feedback
- Contact us
- Sitemap