1 Department of Civil Engineering, Matsue National College of Technology, mailto:kand@ce.matsue-ct.ac.jp
2 Faculty of Life and Environmental science, Shimane University, ohnishi@kunibiki.life.shimane-u.ac.jp
3 Center for Environmental Remote Sensing, Chiba University, ishiyama@cr.chiba-u.ac.jp, tateishi@ceres.cr.chiba-u.ac.jp
This paper aims to develop a remote sensing method of monitoring grain production in the early stages of crop growth in China and India. It is important to oversee the quantity of grain in production at an early stage in order to raise the alarm well in advance if a poor harvest is looming, especially in view of the rapid population increase in Asia and the long-term squeeze on water resources. Grain production monitoring would allow orderly crisis management to maintain food security in Japan, which is far from producing enough grain for its own population. We propose a photosynthesis-based crop production index (CPI) that takes into account all of: solar radiation, effective air temperature, vegetation biomass, the effect of temperature on photosynthesis by leaves of grain plants, low-temperature sterility, and high- temperature injury. The proposed photosynthesis-based crop production index has accurately predicted the rice yield expressed by the Japanese Crop Situation Index in three years, including the worst yield in the last 15 years, at a test site in Japan.
This paper aims to develop a photosynthesis-based crop Production index CPI for monitoring crops in the present era of fresh water shortage.
Key Words
Monitoring, crop production index, Remote Sensing, photosynthesis, World Weather Data, water stress
Introduction
Given the atmospheric phenomenon of global warming, shortage of fresh water resources is now an obvious environmental restriction on the world’s capacity to support life. Unusual reductions in the discharge in the lower reaches of irrigation rivers are being observed, and a continuing fall in the groundwater level as a result of water usage. Such well-known organizations as the World Bank, the Worldwatch Institute (Sandra Postel, 1999) and World Water Council (2003) have warned about the present unsustainable use of water resources for irrigation in China, India, and the U.S., which have significant influence on the total quantity of grain production.
This work aims to develop a predictive method of monitoring the grain quantity in production that would be useful in the present era of increasing world population that needs both food and water. Knowledge of an impending bad harvest in China or India would assist in the planning of both Japanese internal affairs and foreign policy, reducing the economic and social strains caused by the consequent leap in grain prices and improving the security of the food supply; Japan produces only about 40% of its own food.
Background of the proposal for crop monitoring in view of limitations on water resources
Trends in the grain yield of China and India have wide significance because of their huge population and consumption. Chinese rice production should be 189.8 million tons in 2000 (FAO, 2003); rice is the staple that supports the gigantic Chinese population, providing twice the quantity of food as wheat or corn. Rice in India has twice the production of wheat, and its rice harvest is increasing rapidly, from 80.3 million tons in 1980 to 131.9 Mt in 2001 as a result of population increase. Rice production in China increased gradually from 142.8 Mt in 1980 to 202.7 Mt in 1998, but has since fallen a little with the loss of paddy areas to industrialization. It is well known that people who cultivate paddy areas aim to support themselves and their nation, in contrast to wheat and corn, much of which is grown for export. Problems with the rice crop could therefore have a catastrophic effect on countries that import rice and other crops. A poor harvest of paddy rice therefore causes a major disturbance in the world grain market. As a result of Japanese imports of 2.88 Mt of rice following Japan’s worst harvest in 1993, the price in Thailand rose from $220/t to $420/t in just six months (Japan Food Agency, 2002). It then fell drastically to $275 once Japan ceased these imports. This example shows the potential for havoc in Asian rice markets if a harvest is poor. Moreover, although the yield of paddy rice per unit area is higher than that of wheat, and it is able to support large populations, rice demands about 3-4 times as much water per unit weight as wheat.
A few early warning systems exist that are promoted by the Food and Agriculture Organization (FAO, 2003) of the United Nations, and an early watch system by DEWA of Earthwatch (UNEP, 2003), and by USGS. However, these are not based on quantitative monitoring and modeling as described in this paper, but are forecasts based on agricultural weather conditions, involving mainly the seasonal temperature and precipitation. Annual climate changes which cause a poor harvest may involve fluctuations in the latitude of the monsoon rain band, or in the date at which the rainy season begins. Crop production has a statistical character due to annual meteorological variation.
In the 2002 fiscal year, Japan produced 28% of the grain it needed based on weight, 40% based on calories, and 60% based on weight of staple food. This is the lowest value among the advanced nations and raises concerns about the security of the food supply in Japan. Accurate and predictive surveillance of the quantity of grain production in China and India is therefore particularly important for our country.
Method for monitoring crop production
Many conventional crop studies have correlated the grain quantity in production with the growth index of Growing Degree Day GDD, or with water stress indices such as stress degree day.
![]() (1)
(1)
where,Tmax is the maximum daily air temperature, Tmin is the minimum daily air temperature, and Tb is a threshold temperature for the crop, below which physical activity is inhibited and equal to 10°.
Rasmussen (1998) gave the net primary production NPP according to the following formula:
![]() (2)
(2)
where ε is the efficiency coefficient, is the time a and b are regression coefficients, and PAR is the photosynthetically active radiation.
The present research seeks to develop a photosynthesis-type of monitoring method by measuring the water stress so as to improve the formula (2) presented by Rasmussen. The final form of the photosynthesis rate is defined in formula (3), which takes into consideration the solar radiation, air temperature, stomatal opening, and vegetation biomass.
![]() (3)
(3)
where, PSN is the photosynthesis velocity, APAR is the absorbed photosynthetically active radiation,
βs is the stomatal opening a and b are Michaelis -Menten constants, Tc is the canopy temperature, eLAI is the effective leaf area index, and fster is the sterility response function of air temperature.
The integrated photosynthesis type of crop production index CPI is defined by the following formula concerning the period from seeding ts to harvest th.
![]() (4)
(4)
where Fster is the response function of temperature sterility effects on crop production.
Many researchers have presented crop simulation models that involve growth of crops and incorporate remote sensing data from previous years. However, it is desirable to express the mechanism of growth and filling more simply than in these models, which are complex and contain many empirical constants (Monteith 1996, Sinclair and Seligman 1996). By measuring growth of crop vegetation using remote sensing instead of simulation, the present paper estimates the photosynthesis rate by treating the growth of crop as a known variable.
Data used in the modeling
Estimation of the photosynthesis rate needs daily data of solar radiation and air temperature, so that the
meteorological data must be routine daily weather data as taken throughout the world. The world weather data is most suitable for the index CPI because daily regular data are currently observed as weather reports in real time.The crop production index CPI requires the vegetation index NDVI at the positions of the world weather sites using a data set derived from NOAA AVHRR by Tateishi (2001). The vegetation index NDVI is extracted at pixel numbers calculated from the longitude and latitude of the weather observatories.
The background analysis of the grain quantity of production in China and India was based on data from the Food and Agriculture Organization FAO of the United Nations.Japanese domestic data for the grain trade and the total grain tonnage produced are based on the agricultural statistics information database of the Ministry of Agriculture, Forestry, and Fisheries.
Results by growing indices and crop production index
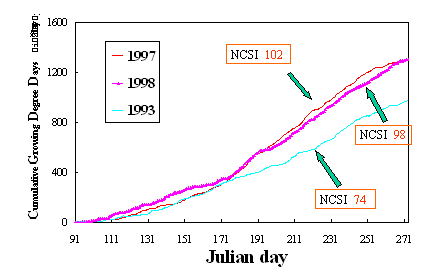
Fig.1 shows the relation between the GDD and the Crop Situation index for paddy rice at Kuki, which is a verification site in Japan. The growth index GDD was able to represent the poor harvest, having low Crop Situation index (NCSI) 74 of paddy rice, following damage by exceptionally cold weather in 1993, but GDD could not represent the bad harvest of Crop Situation index 98 in 1998 that was due to insufficient solar radiation even though the temperature was adequate.

Fig.1. Seasonal curves of cumulative growing degree day GDD and relation to the crop situation index NCSI of rice at the validation site of Kuki in Japan.
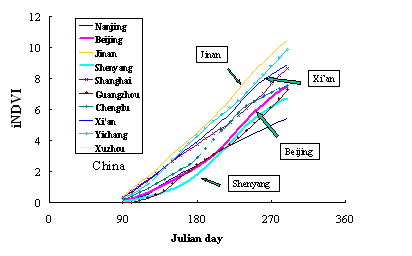
Fig.2 shows the integrated NDVI around the monitoring points in China. If there is neither water stress nor low temperature sterility around the time of flowering, the crop quantity of production should be high in crop areas where the integrated vegetation index iNDVI is large.Therefore the large values of the integrated vegetation index at Jinan or Yichan in Fig. 2 suggest a good harvest in those areas. The iNDVI is a vegetation growing index, which measures the crop plant density. However, the iNDVI cannot, for example, express the effect of a lack of sunshine, or effects of low-temperature sterility during flowering and filling.

Fig.2. Integrated NDVI (iNDVI) of paddy fields in China as a growth index for crop production.
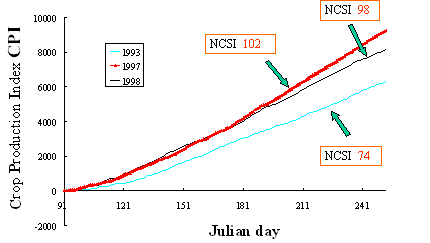
Fig.3 shows the photosynthesis-based crop production index CPI taking into consideration the vegetation index NDVI as vegetation biomass as well as solar radiation and effective air temperature GDD. The values of the Crop Situation index at Kuki site in Saitama prefecture are included in the figure. The CPI index clearly shows the poor harvest due to low temperatures in 1993, and that due to lack of sunshine in 1998,and captures also the quantitative difference between the good harvest in 1997 and these poor harvests. The discernment ability is much greater than the growing indices GDD and iNDVI. The photosynthesis-based crop production index CPI turns out to be a good index for monitoring. One of the authors (Kaneko, 2003) is proposing a CPI that accounts for sterility below air temperatures of 18.5 centigrade and injury above 40 degrees ( Matsui et al. 1997).

Fig.3. Daily variation of crop production index CPI at the validation site of Kuki observatory in Japan with values of the crop situation index NCSI.
Conclusions
We propose a photosynthesis-based crop production index CPI taking into consideration such factors as solar radiation, air temperature, vegetation biomass, and stomatal opening using satellite data and world weather data. The present CPI index proved more accurate than the conventional cumulative GDD and the integrated NDVI as a crop production index for early monitoring of paddy rice. Organization of crop surveillance using accurate quantitative models based on daily data should be established as routine in view of the consequences for Japan of problems with crop growth, threatening our food security. Strategies for crisis management should be available in advance. Technical collaboration and information supply for early warning by the monitoring method proposed in this paper would be useful in guiding agricultural policies of Asian circumference countries.
Acknowledgment
This study is funded by Grants-in-Aid for Scientific Research, for which we thank the Japan Society for the Promotion of Science, which is part of the Ministry of Education, Culture, Sports, Science and Technology.
References
Food and Agriculture Organization of the United Nations ( 2003). FAO FAOSTAT Database:
Kaneko D (2002). Estimation of global solar radiation using world weather data for early monitoring of crop production by satellites, Proceedings of 6th symposium on water resources, Tokyo, 677-682. (In Japanese with English abstract).
Kaneko D, Onishi M, and Ishiyama T, (2003). Proposal of early monitoring method for crop production in China and India in the recent era of water resources restriction Environmental Systems Research, Japan Society of Civil Engineering, 31, 235-244. (In Japanese with English abstract).
Kaneko D, Onishi M. (2003). Modeling on indices for monitoring crop production using meteorological data and Vegetation Index NDVI, Japanese Journal of Crop Science, 72(Extra issue 2), 92-93. ( In Japanese)
Matsui T, Namuco OS, Ziska LH and Horie T, (1997). Effects of high temperature and CO2 concentration on spikelet sterility in indica rice, Field Crops Research, 51, 213-219.
Monteith J L, (1996). The quest for balance in crop modeling, Agronomy Journal, 88, 695-697.
Rasmussen MS, (1998). Developing simple, operational, consistent NDVI-vegetation models by applying environmental and climatic information: Part II. Crop yield assessment, International Journal of Remote Sensing, 19(1), 119-137.
Postel S, (1999). Pillar of sand – Can the irrigation miracle last? -, W. W. Norton & Company, Inc., New York, U.S.A. with the Worldwatch Institute, Washington, D.C.,U.S.A .
Tateishi R (2001). Twenty-year global 4-minute AVHRR NDVI dataset, CEReS, Chiba University.
United Nations Environmental Programme (UNEP) (2003). Division of Early Warning and Assessment (DEWA).
World Water Council (2003). The 3rd World water forum, Thematic/Regional statements Ministerial declaration, 105pp.
Search Site
- Crop Science
- Help/Feedback
- Contact us
- Sitemap


